
Graph UI and export
npx -y @sylphx/repomap serve [dir] [--port 7878] [--no-open]
npx -y @sylphx/repomap export [dir] [--out repomap.html]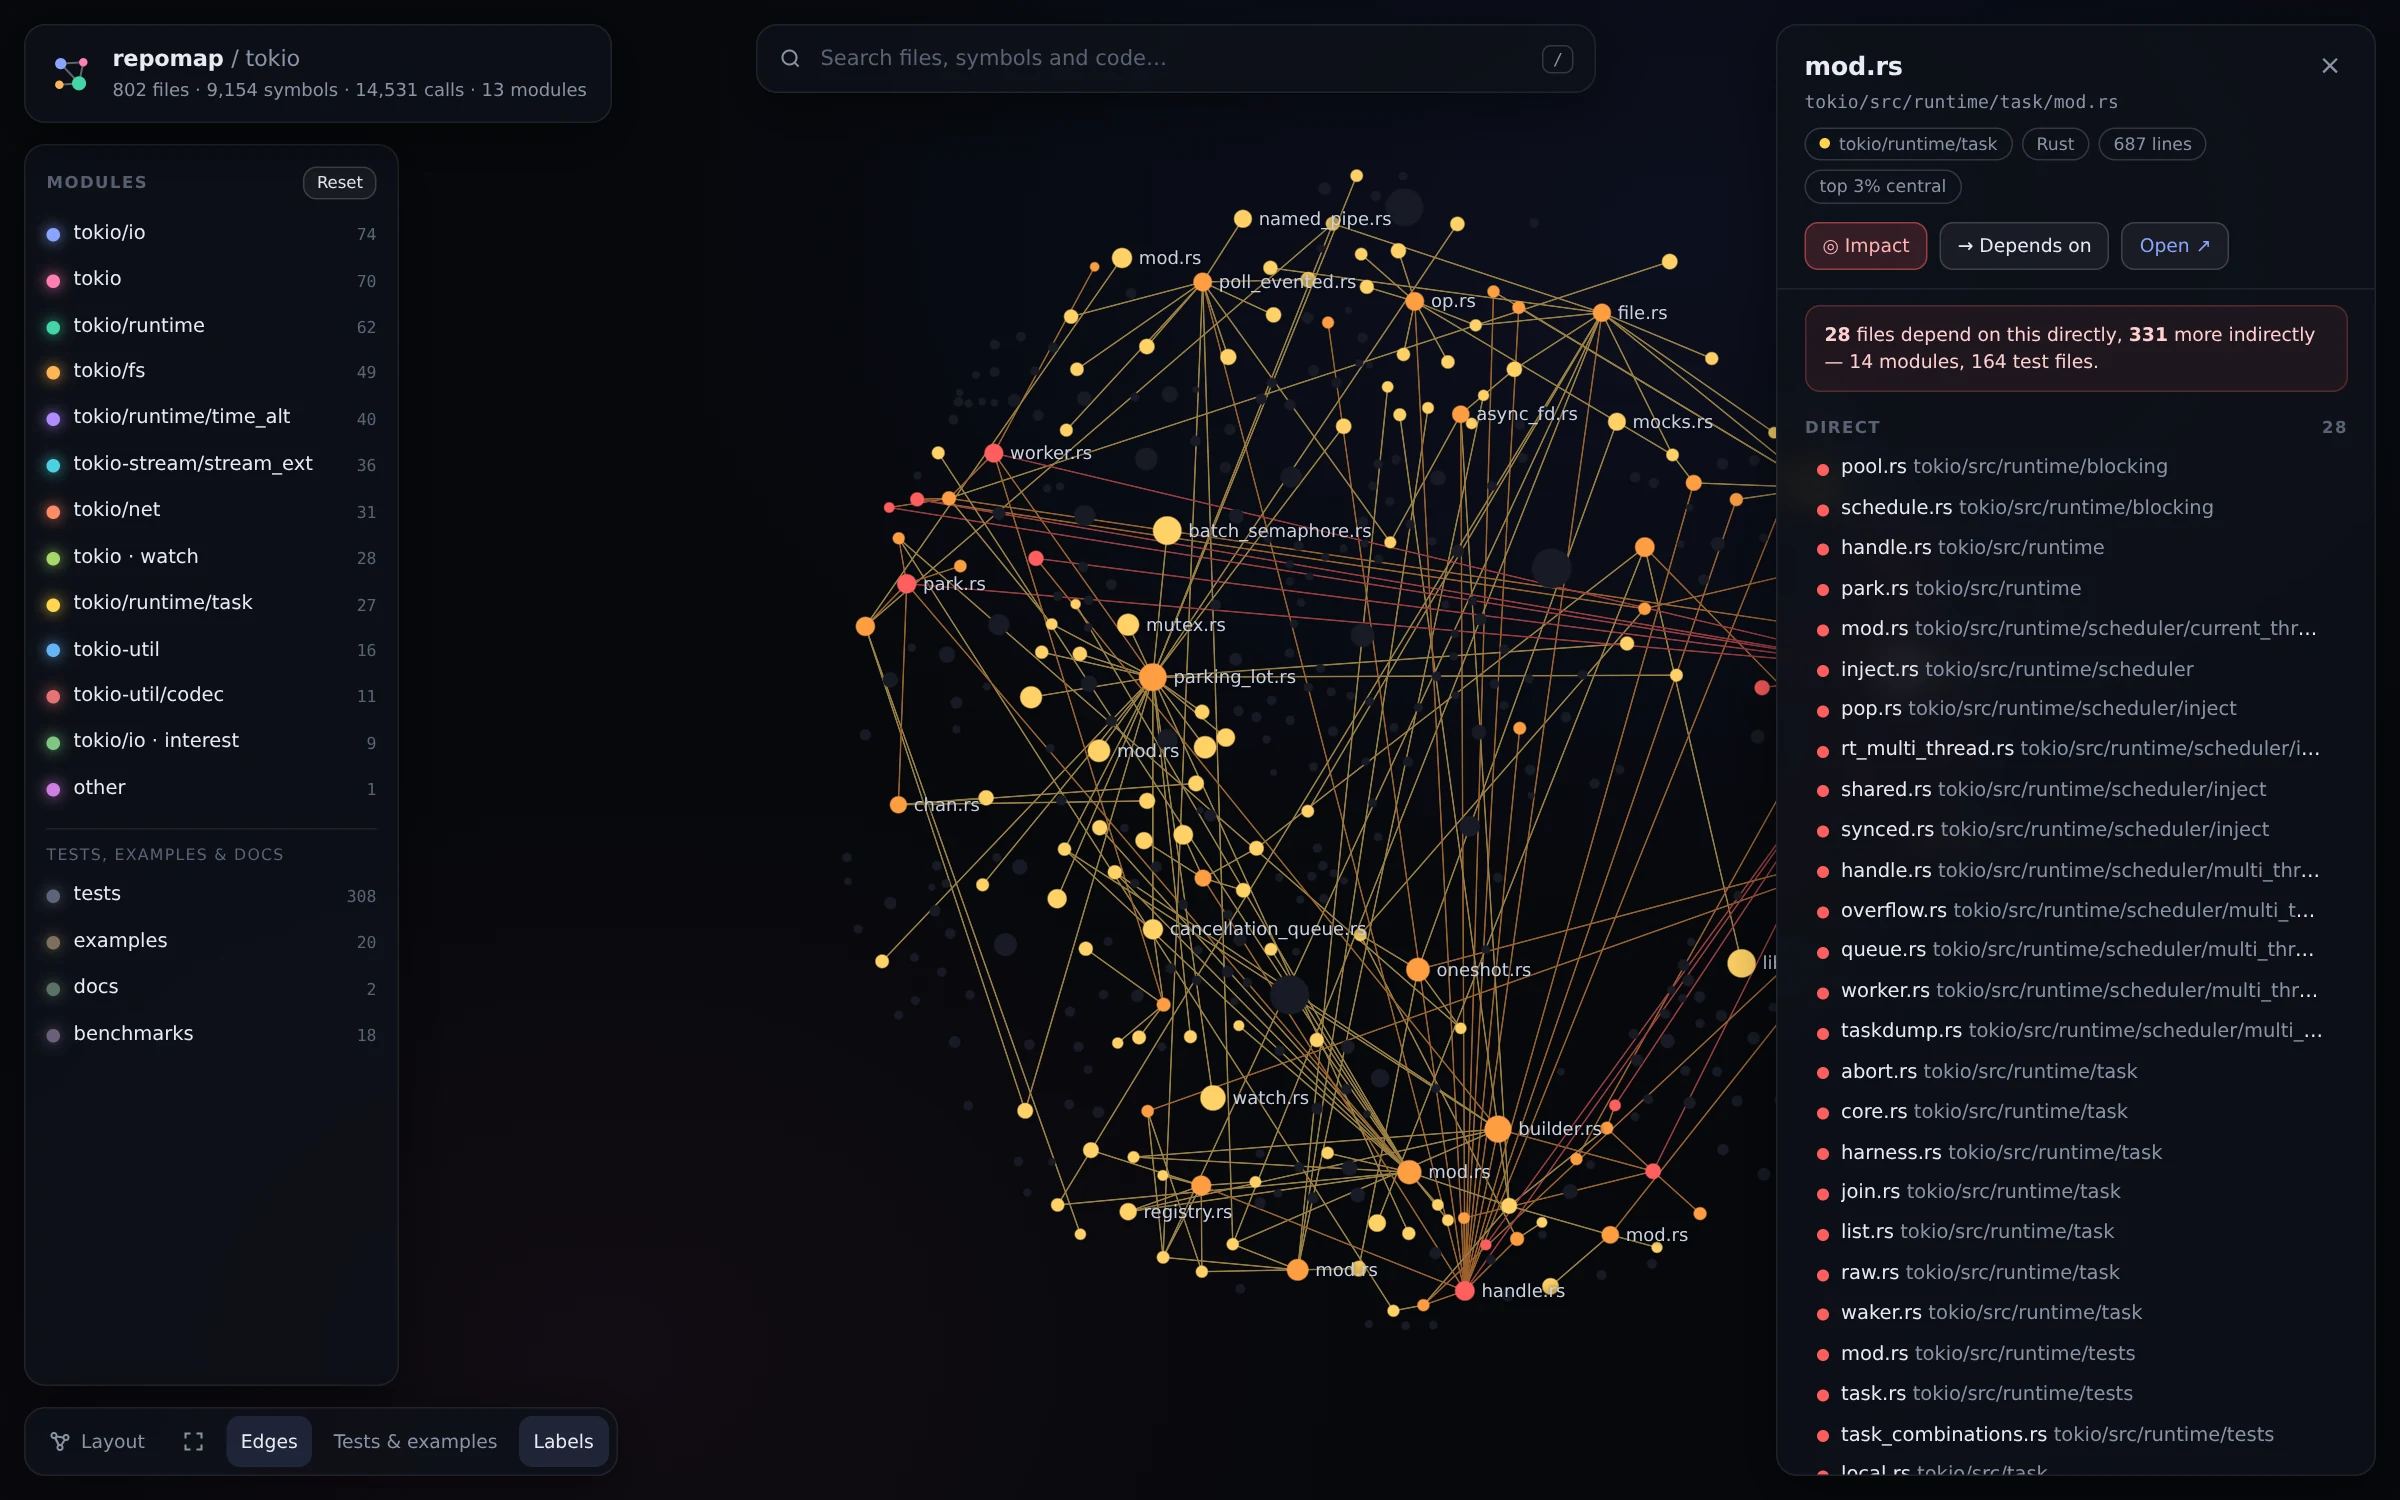
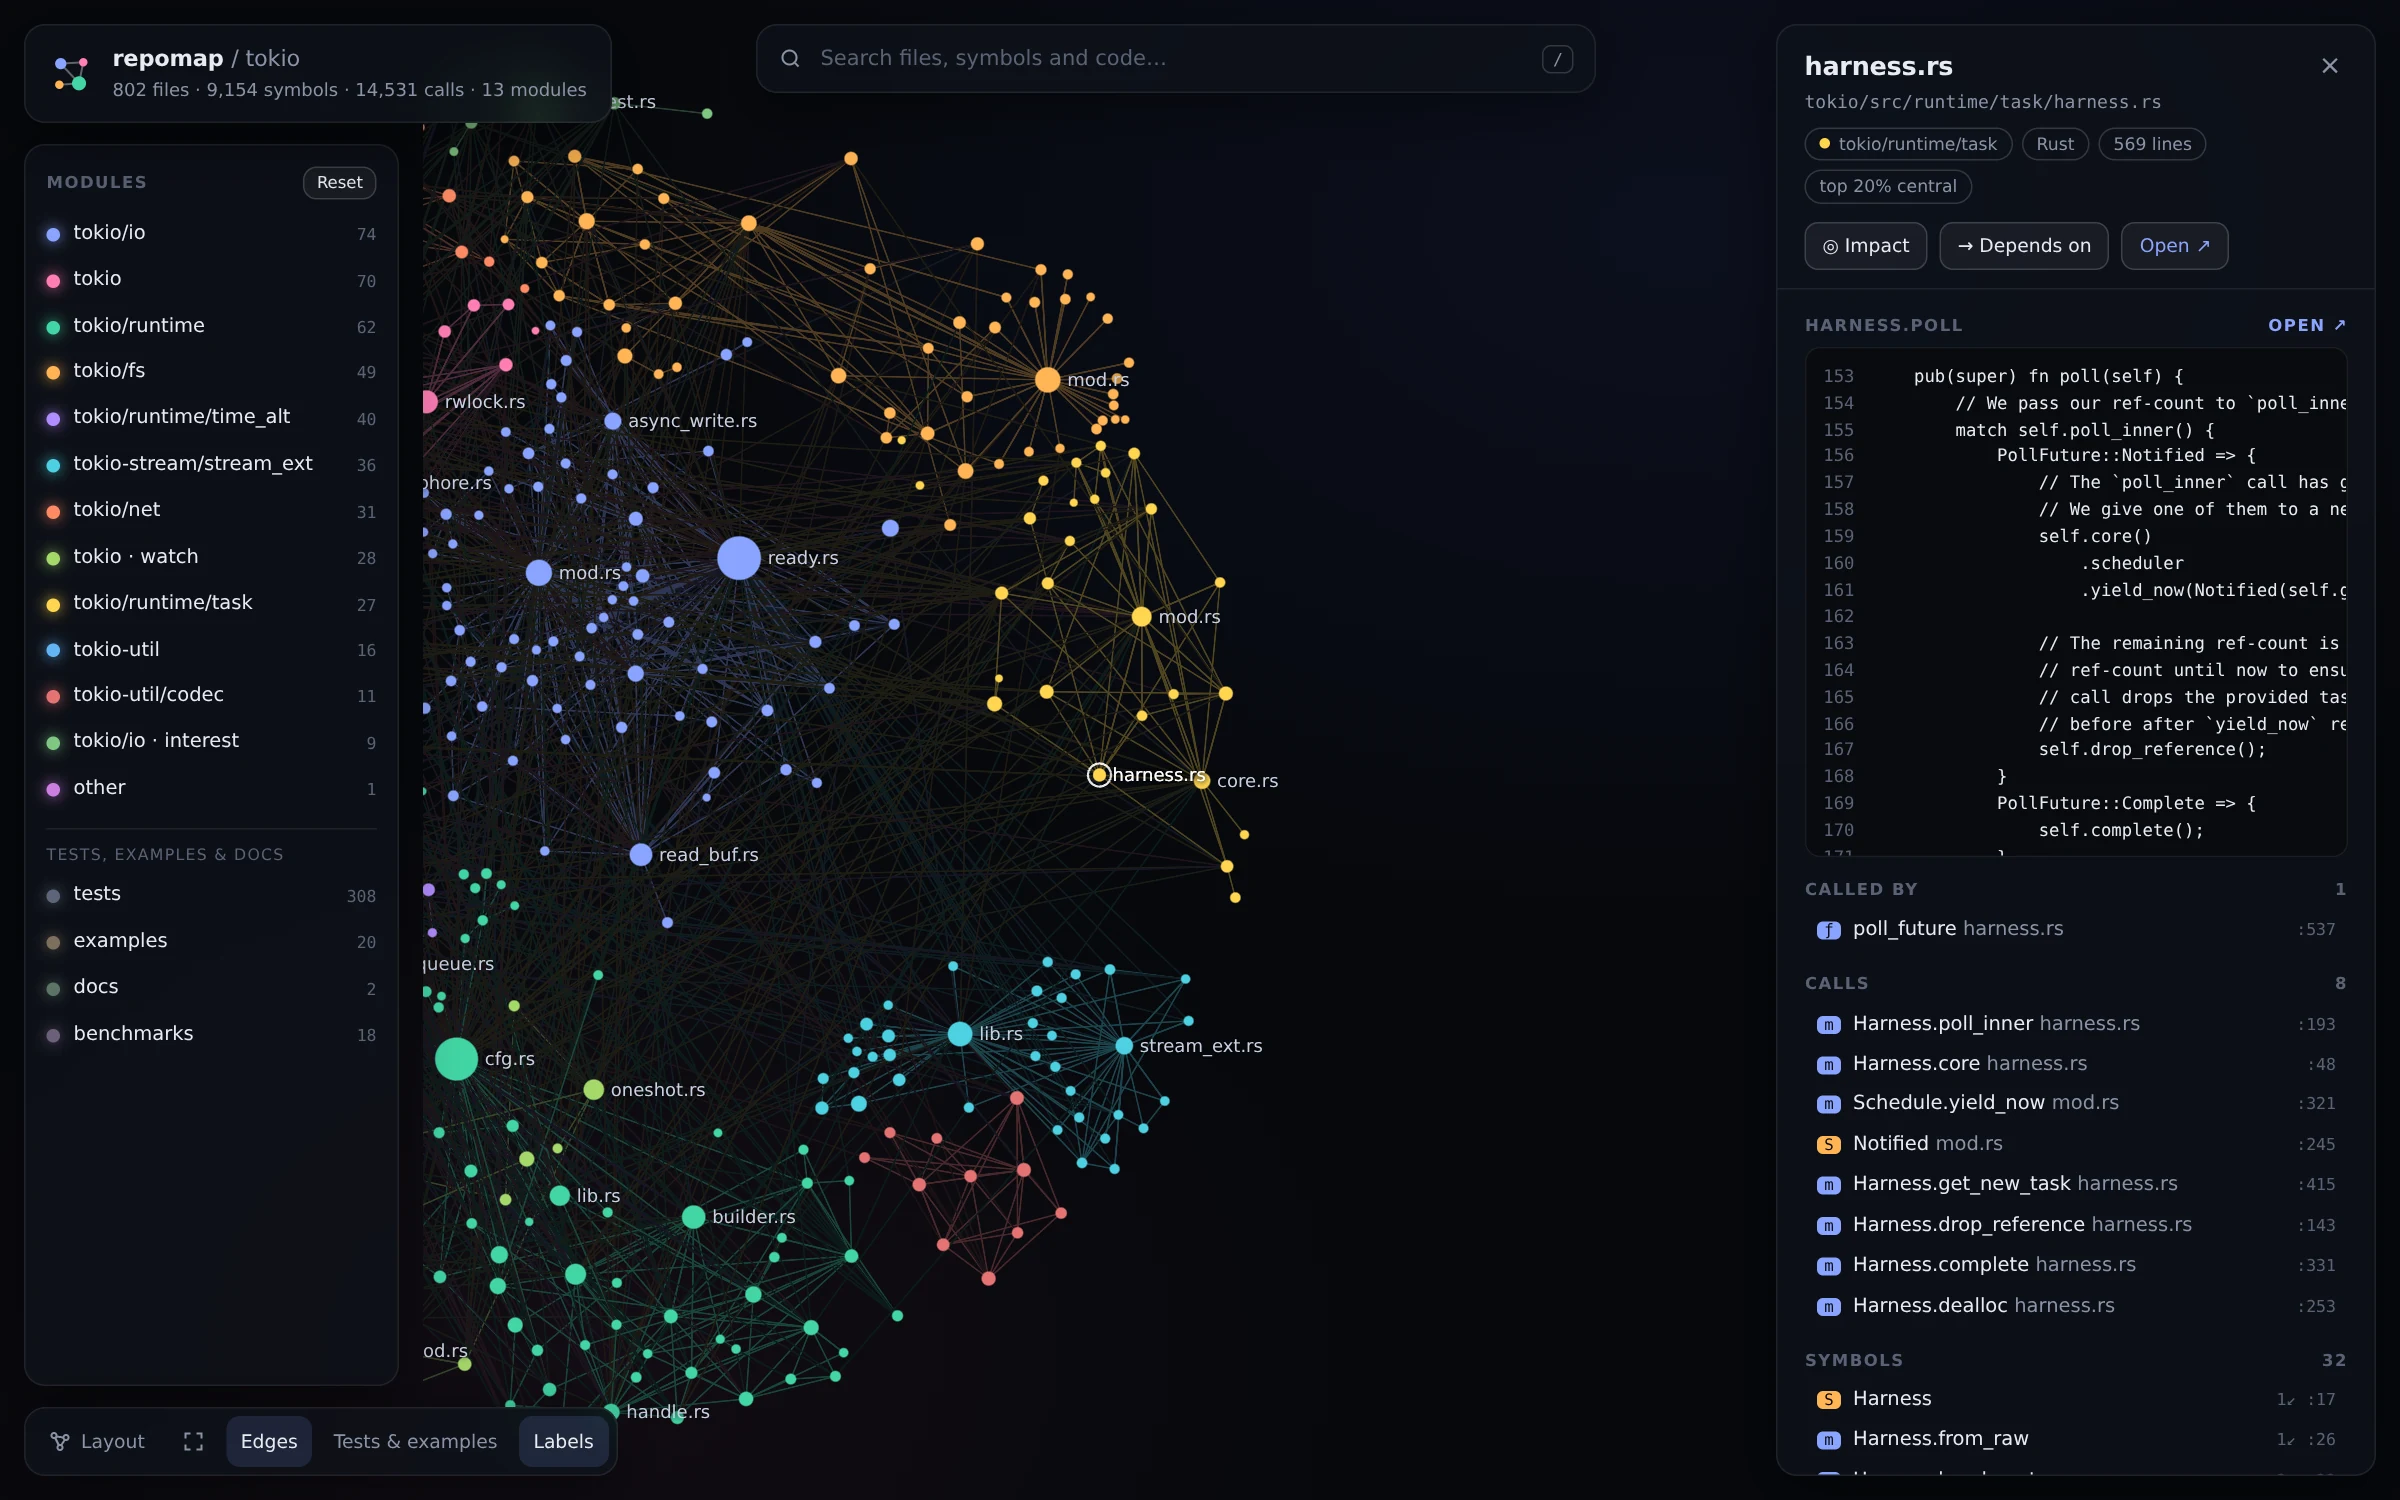
What you see. Every node is a source file. Tests, examples, docs and benchmarks are grouped by role and muted. In larger repos they are hidden until you click Tests & examples. Colours are modules, detected with Louvain community detection on the import and call graph. Node size is PageRank centrality, and edges are resolved dependencies. The layout is ForceAtlas2, running in a web worker.
| Action | How |
|---|---|
| Search files, symbols, code | / or ⌘K, arrows, Enter |
| Inspect a file | click it: module, size, centrality, symbols, used by, depends on |
| Read a symbol | click it in the panel: source, callers and callees (serve mode) |
| Blast radius | Impact or i: dependents by depth (red → orange → yellow) |
| Dependencies | Depends on or d |
| Focus a module | click it in the legend (Shift-click hides it) |
| Fit / clear | f / Esc |
| Share a view | the URL hash is the selected file: …/repomap.html#src/server.ts |
Export writes one self-contained HTML file with the graph, symbol lists and UI included. It doesn't need a server. If the repo has a GitHub remote, Open ↗ links point to the exact commit. Search in export mode covers files and symbols. Full-text code search and code preview need serve.
Recording a demo
The README GIF is the real UI, recorded with Playwright by scripts/record-demo.py and converted with ffmpeg:
repomap serve --no-open ~/code/excalidraw &
python scripts/record-demo.py http://localhost:7878/ /tmp/rec restoreElements
ffmpeg -ss 0.5 -i /tmp/rec/*.webm -vf "fps=10,scale=760:-1:flags=lanczos,split[a][b];[a]palettegen=max_colors=64:stats_mode=diff[p];[b][p]paletteuse=dither=none:diff_mode=rectangle" demo.gif